
Skills by group
Go to the Analytics module and select Skills by group. From this report, you can generate an overview showing the average scores for a specific skills across the entire group.
Create new Skills by group report
To create a report, click New Report. You will now need to enter a number of parameters to generate the desired overview:
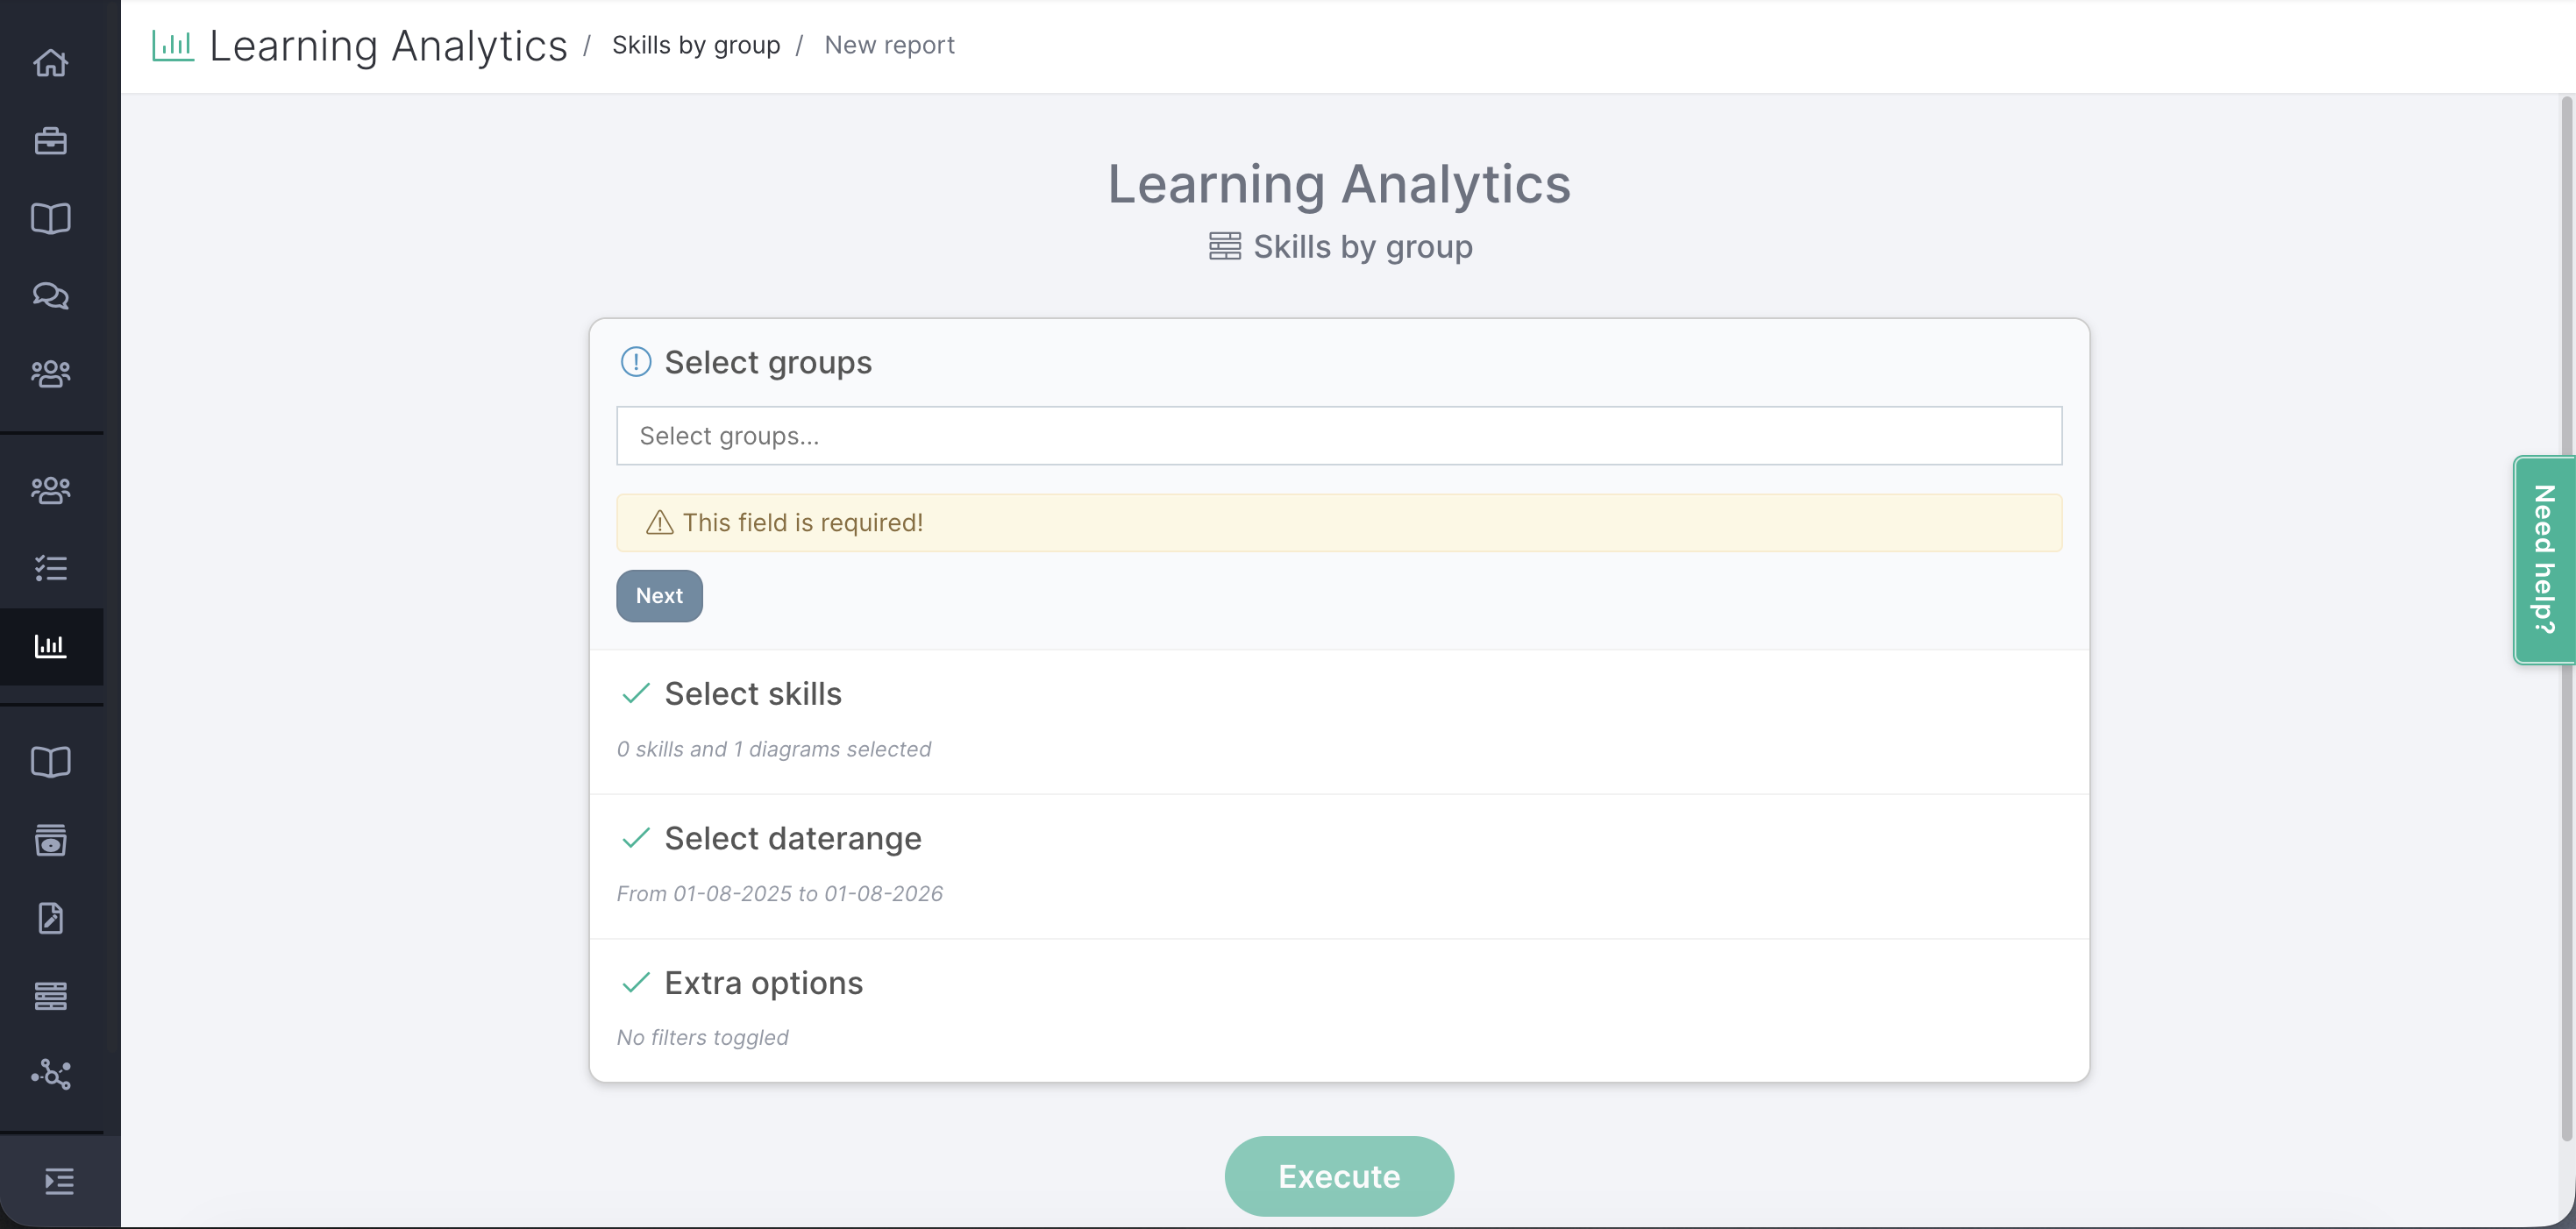
- Select Groups: Specify which groups should be included in the report. It is possible to select multiple groups.
- Select Skills: Choose which skills diagram(s) or competencies (visible under More Options) the report should cover. It is possible to select multiple charts and/or competencies.
- Select Time Range: Specify the period for which the report should be generated.
- Additional Options: Apply a filter. You can choose from the following options:
- Only include completed assignments – Only completed assignments will be counted in the report.
- Use criteria value – Display only the exact value of the criterion.
- Hide Performer column – Hides the column showing the student's self-assessment.
- Hide Student column – Hides assessments provided by students who are marked as evaluators.
- Hide Teacher column – Hides assessments provided by teachers.
- Hide Third Parties column – Hides assessments provided by external reviewers and students invited through reflection invitations.
Report skills average per group
The report shows the average score achieved for a competency across the entire group. By selecting multiple groups, you can make comparisons.
The display can be presented in different ways:
- Table: The scores are shown in tabular form.
- Chart: The scores are displayed in a chart.
- Bar chart: The scores are displayed in a bar chart.

Save or download the report
The report can be saved for later use. This can be done with the green Save button. The saved reports can be found under the Competencies tile.
The report can also be downloaded with the Download button. Chose for the blue button. The download will be made into a Excel file.